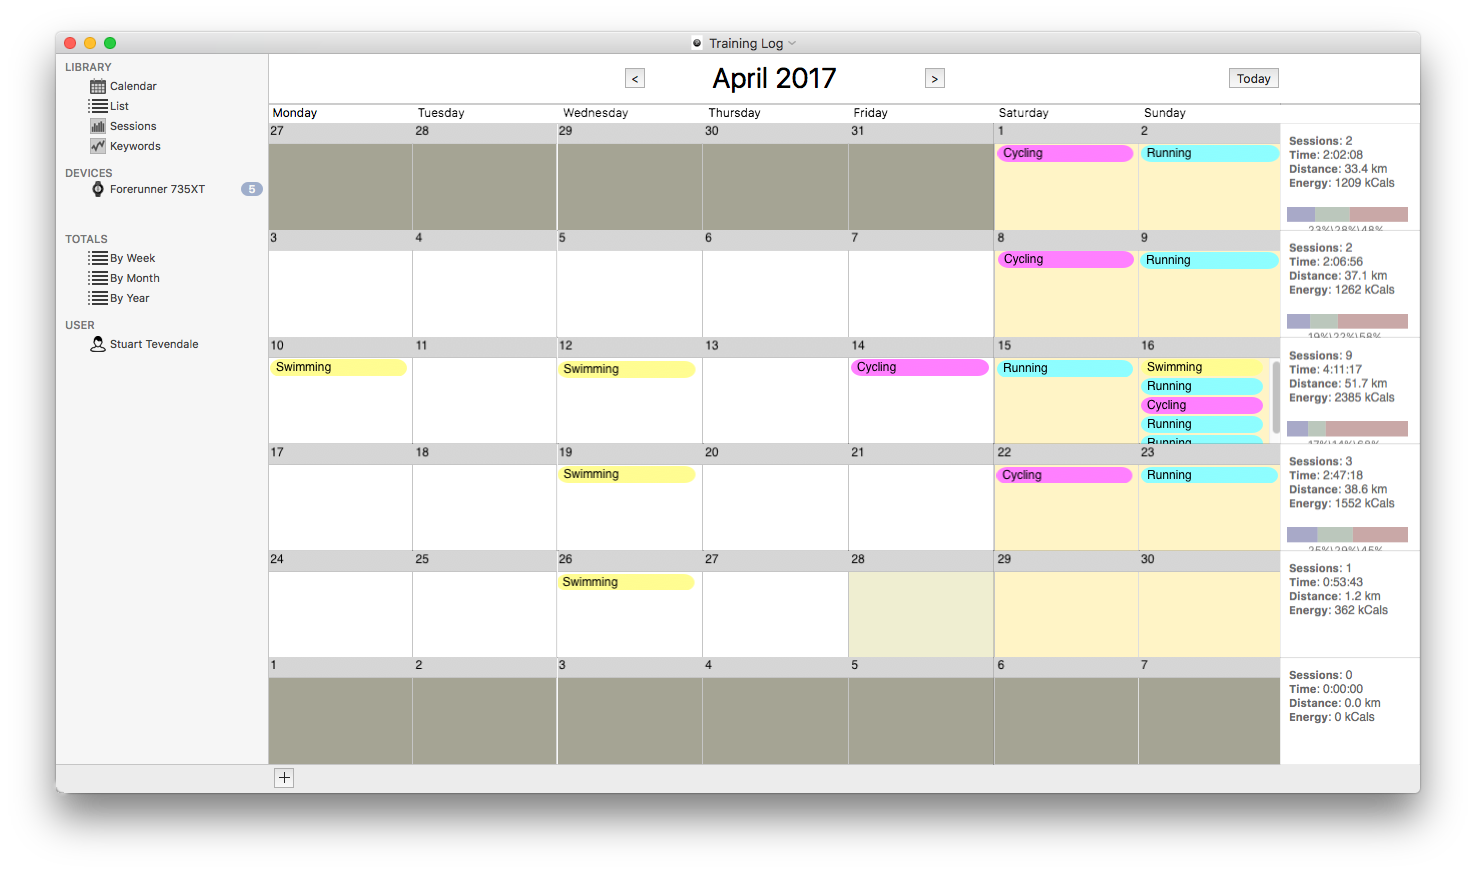
Calendar View
Displays the training sessions in a calendar format. A summary of each session is displayed by clicking on it.
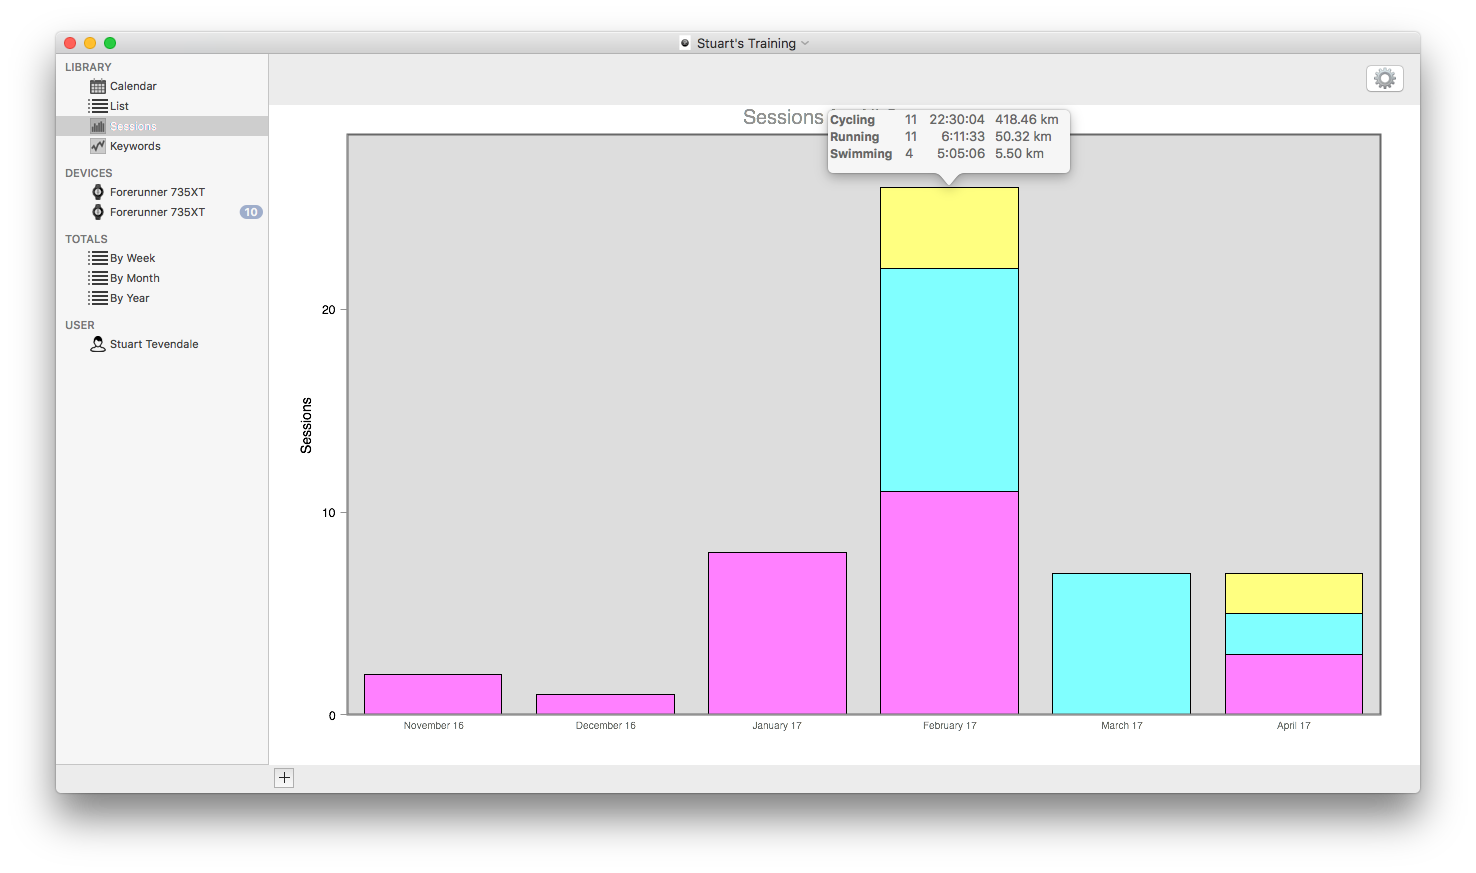
Sessions Graph
Shows the sessions in bar graph form. Each bar represents the number of sessions, the distance covered or the time spent training for each week or month of the period displayed.
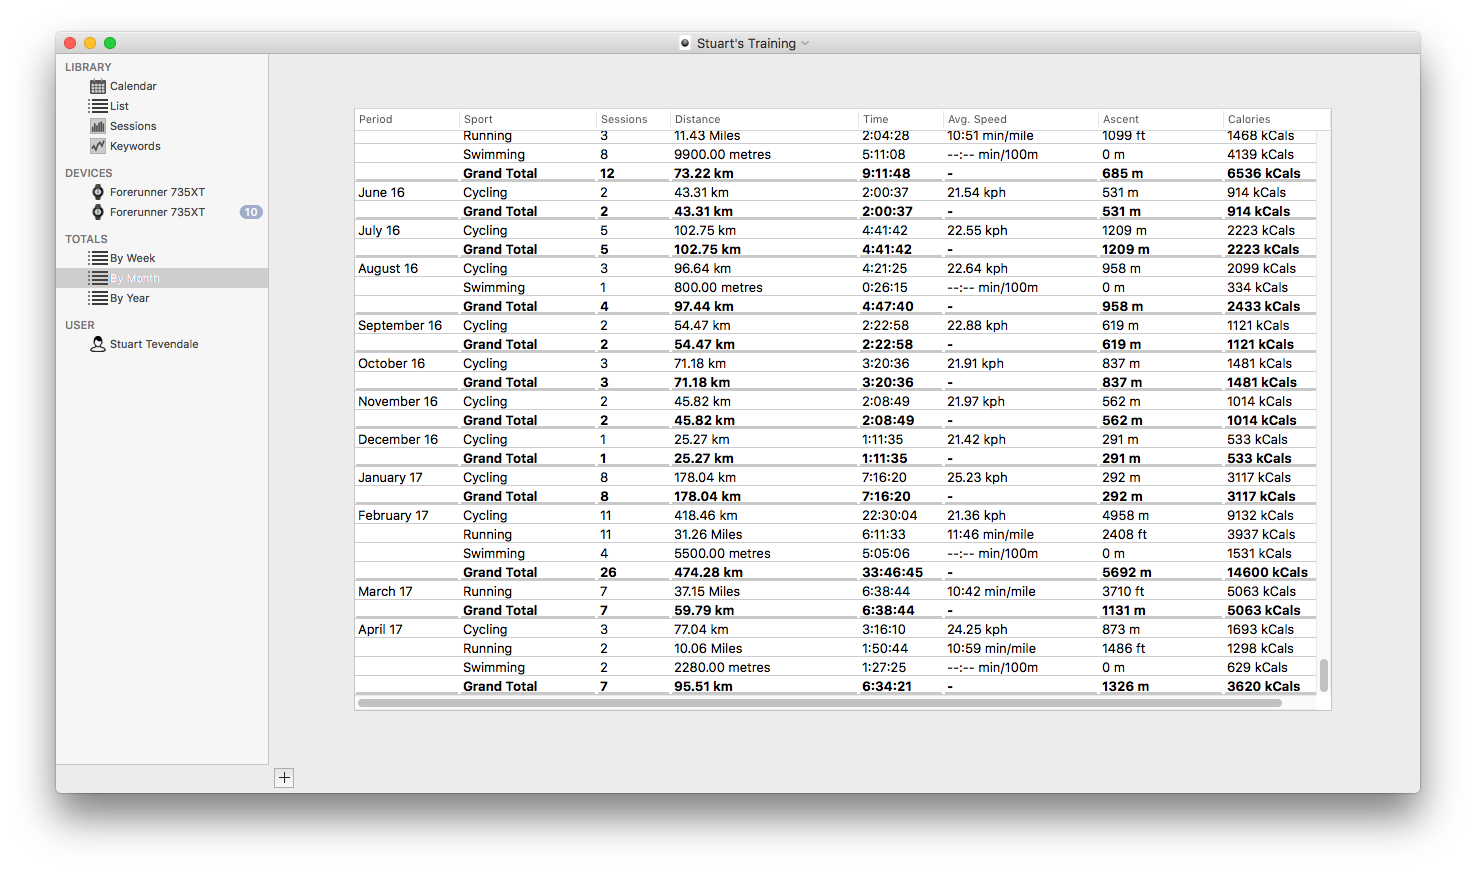
Totals
Shows the total distance, time and number of sessions for your list. The totals can be shown by week, month or year.
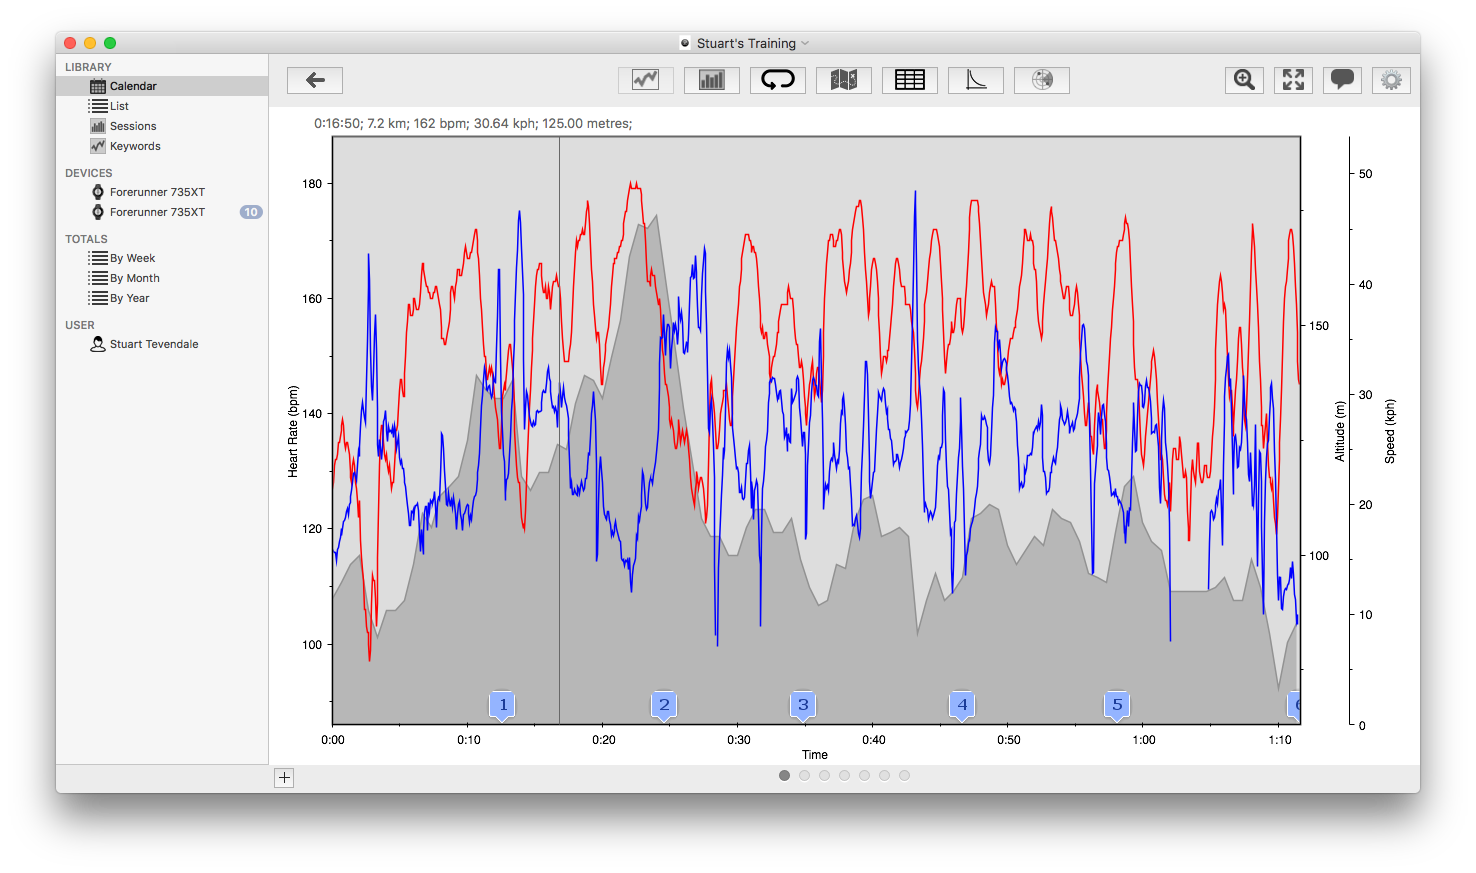
Data Graph
Shows the downloaded data from a Heart Rate Monitor or Power Meter in graphical form. It can show Heart Rate, Speed, Altitude, Cadence, Power, LR Balance and Pedal Index. The data shown can be switched on and off to show only the items of interest. An area of the graph can be selected, and the data for this section displayed.
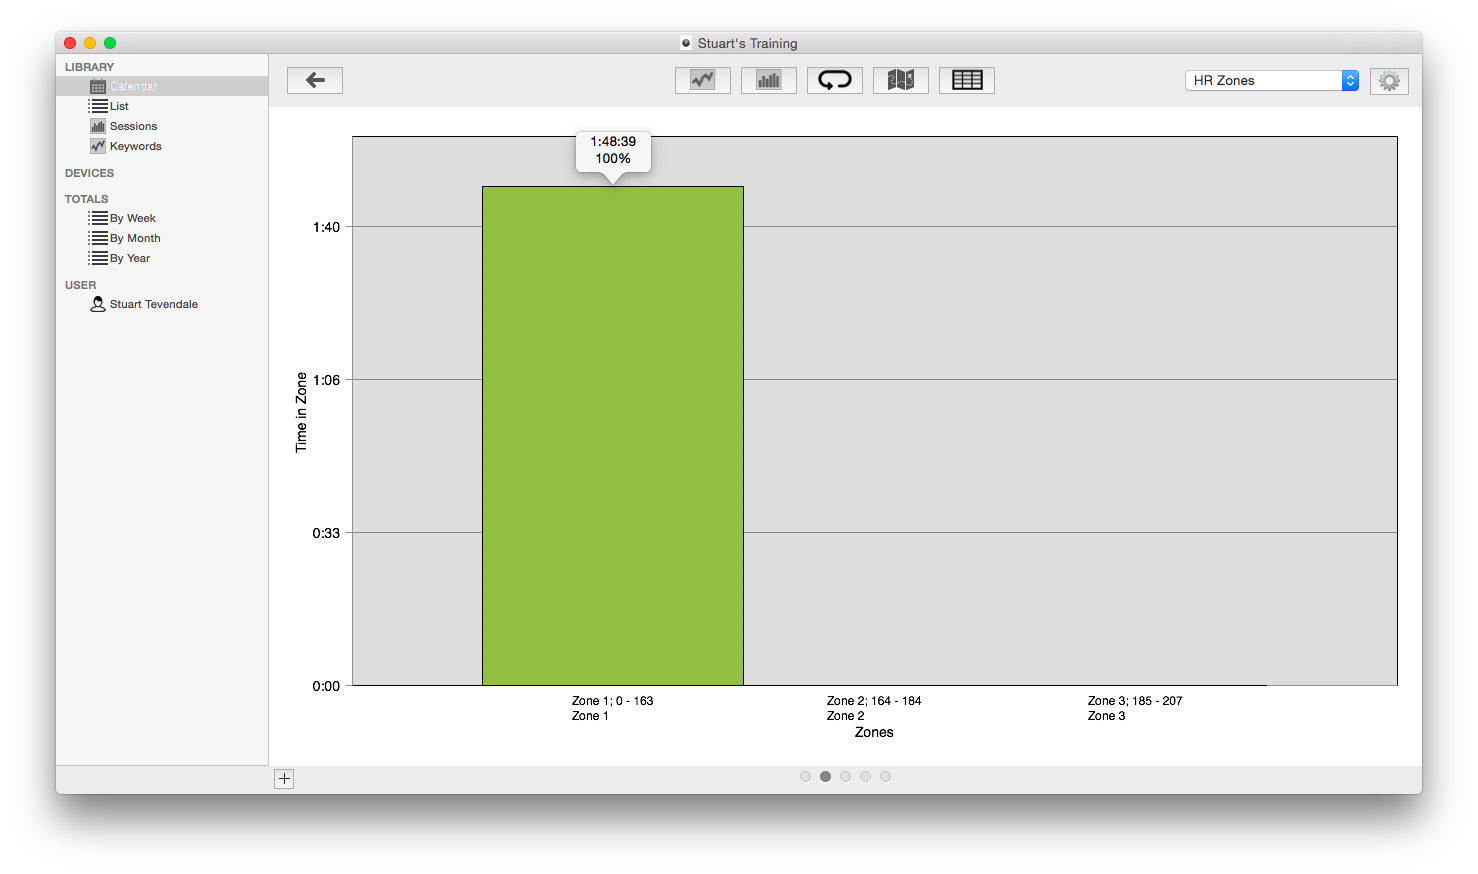
Data Zones
Shows the amount of time spent in each heart rate or power 'zone'. The upper and lower limits of each zone are defined in the User Preferences. Each bar represents the total time that the data has spent between the two limits.
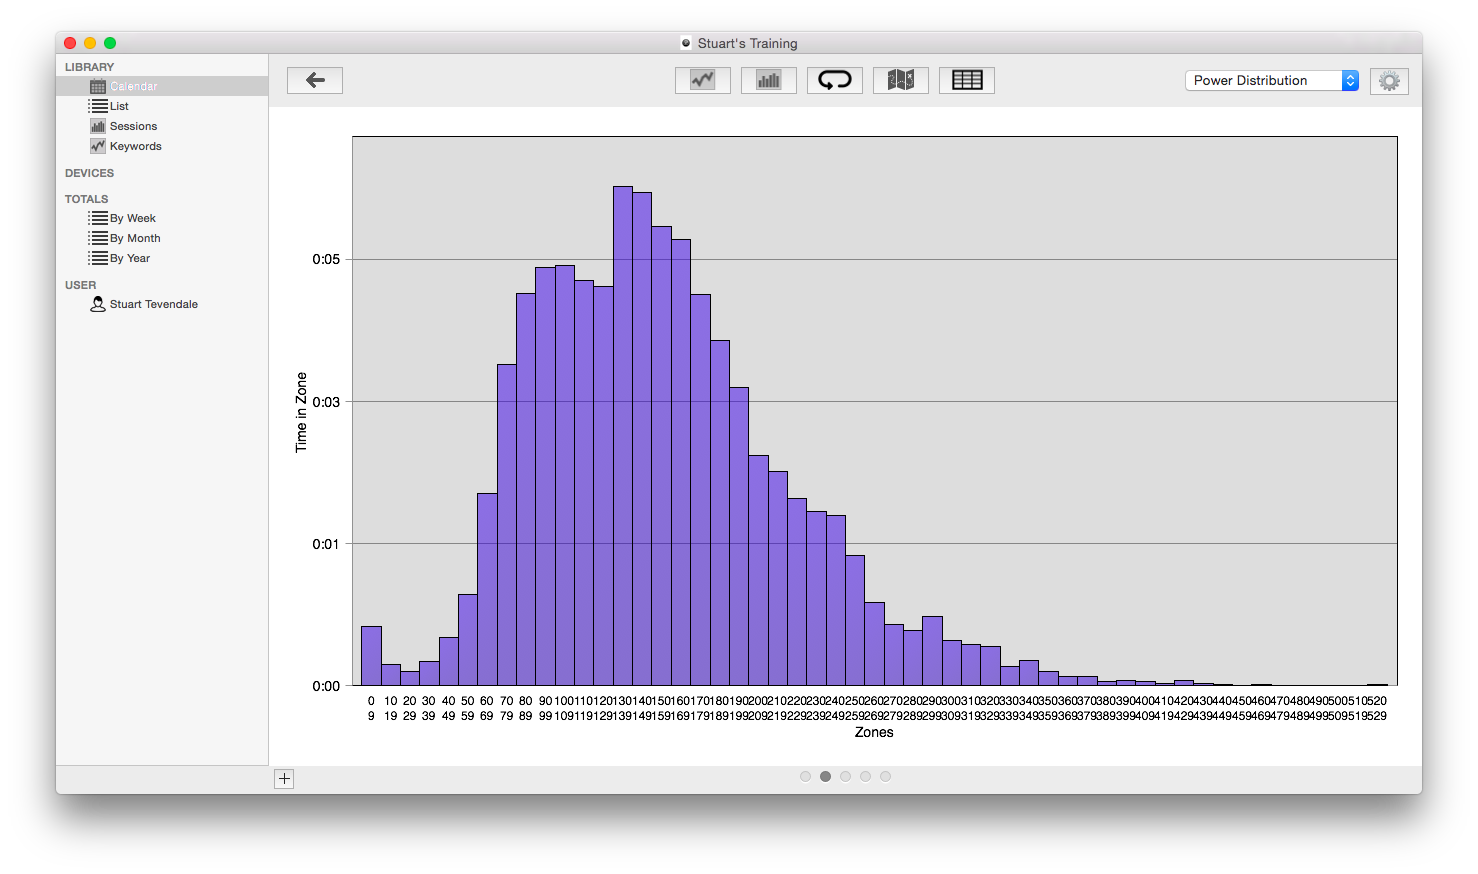
Data Distribution
The window shows the distribution of the downloaded data, showing the time spent in discrete 'bars', each bucket having a size of 1, 5, 10 or 20. For instance, the screenshot shows power data for 10-units blocks, showing the time and percentage of the total duration spent in that bar.
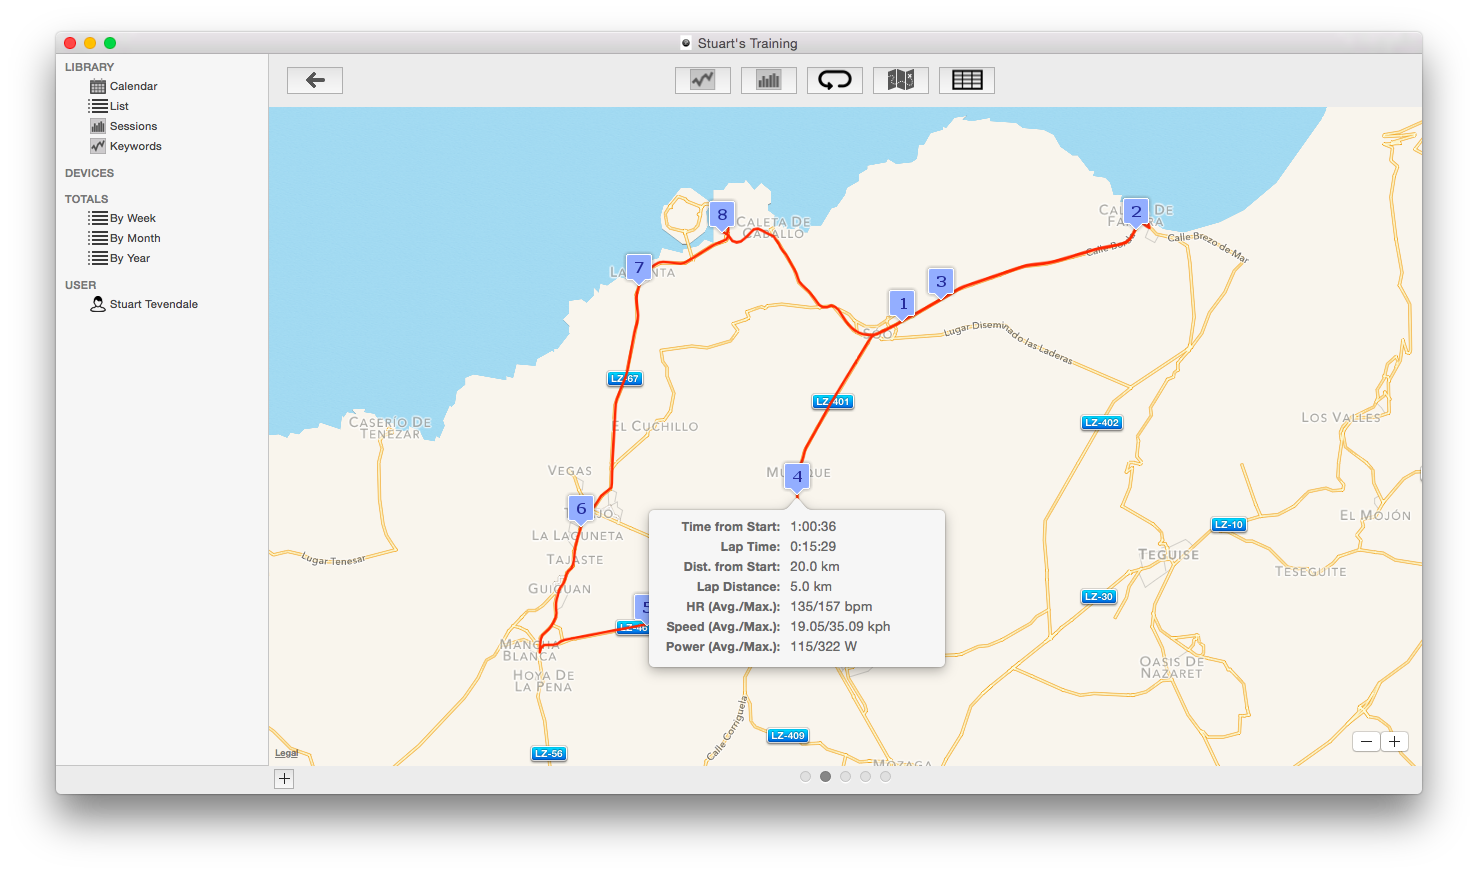
Map
GPS route data can be displayed overlaid on a map of the area. Lap markers are also shown on the map and a summary of each lap can be displayed by clicking on the marker.
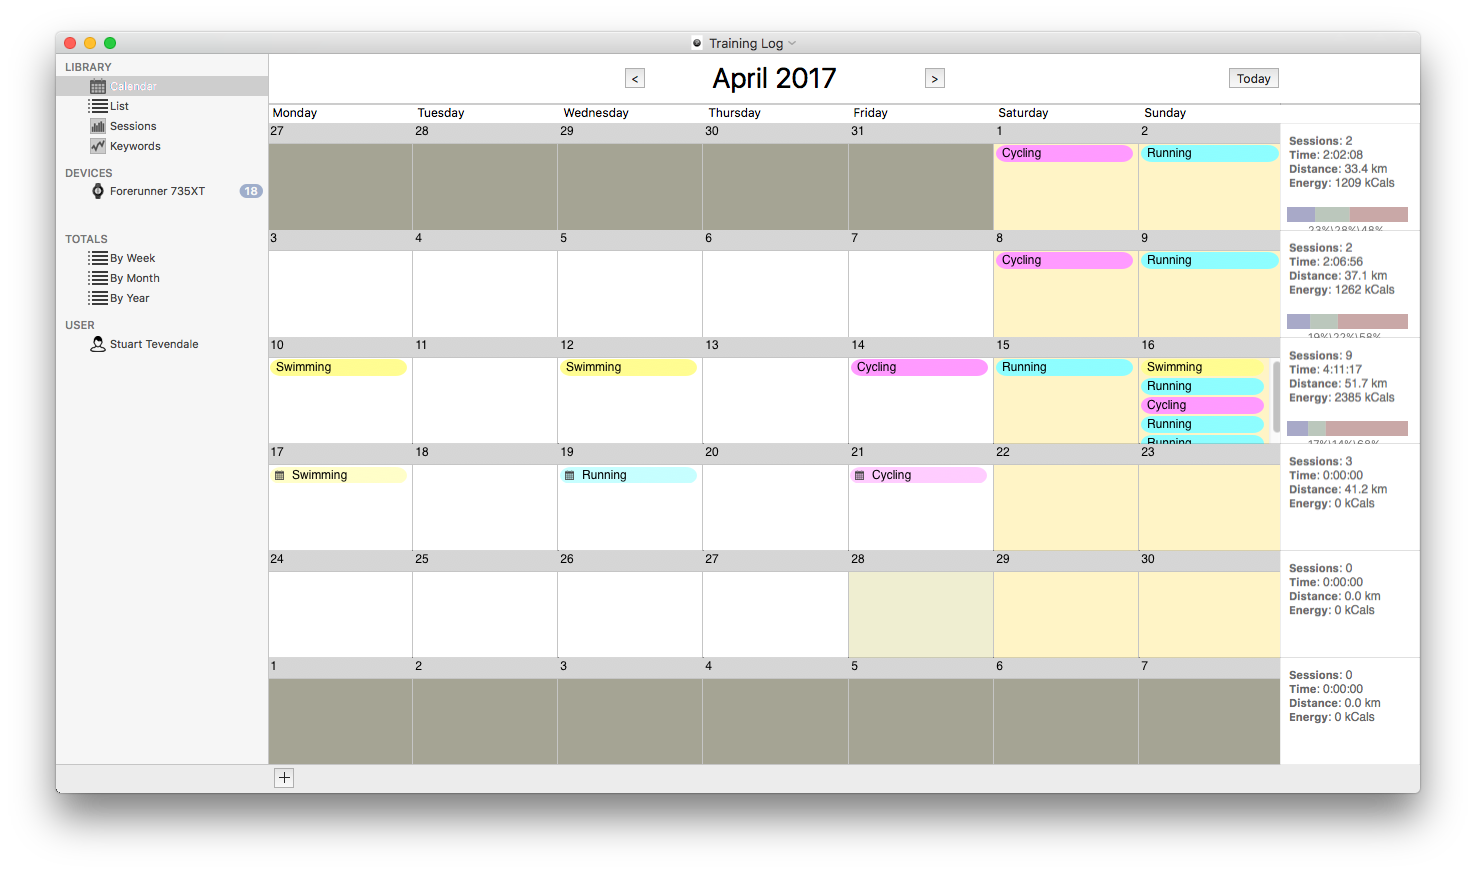
Planned Sessions
Planned sessions can be added to the calendar. This sessions display with a calendar icon on the title.