Download
Download Heart Rate, Speed, Altitude and Power Data from a number of GPS devices, heart monitors and power computers, including Garmin, SRM, CycleOps/PowerTap and Polar - see here for details for the supported models.
Display Downloaded Data
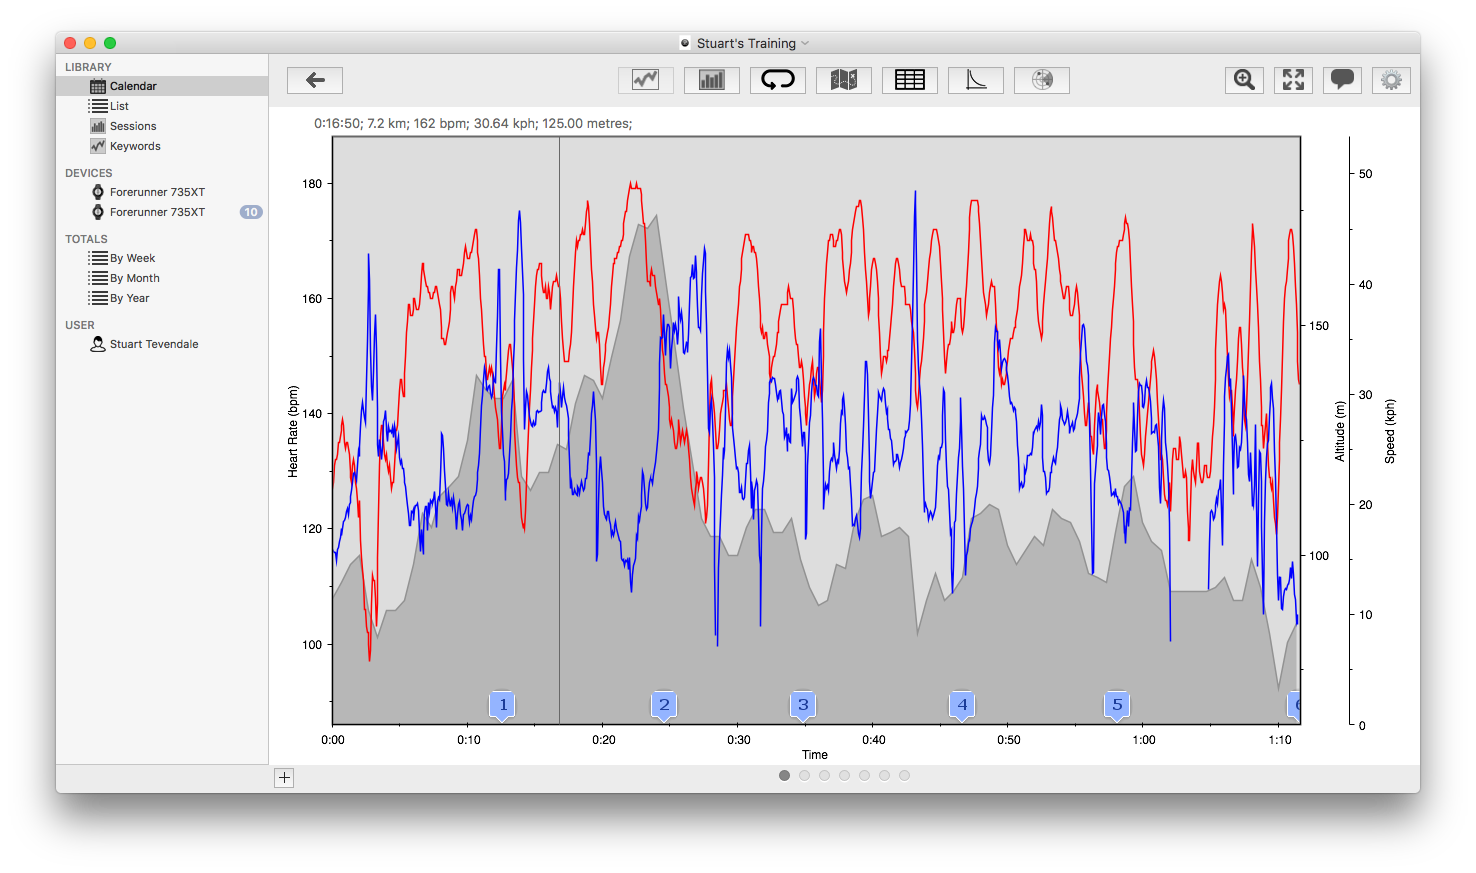
Data that has been downloaded from heart monitors and power meters can be viewed as a graph, showing HR, Speed, Power, Altitude, etc. The maximum and average values for each data type can also be shown, for the entire session or for each lap. A single reading on the graph can be selected, or a region of the graph selected and the data for that area shown.
Review Session Data
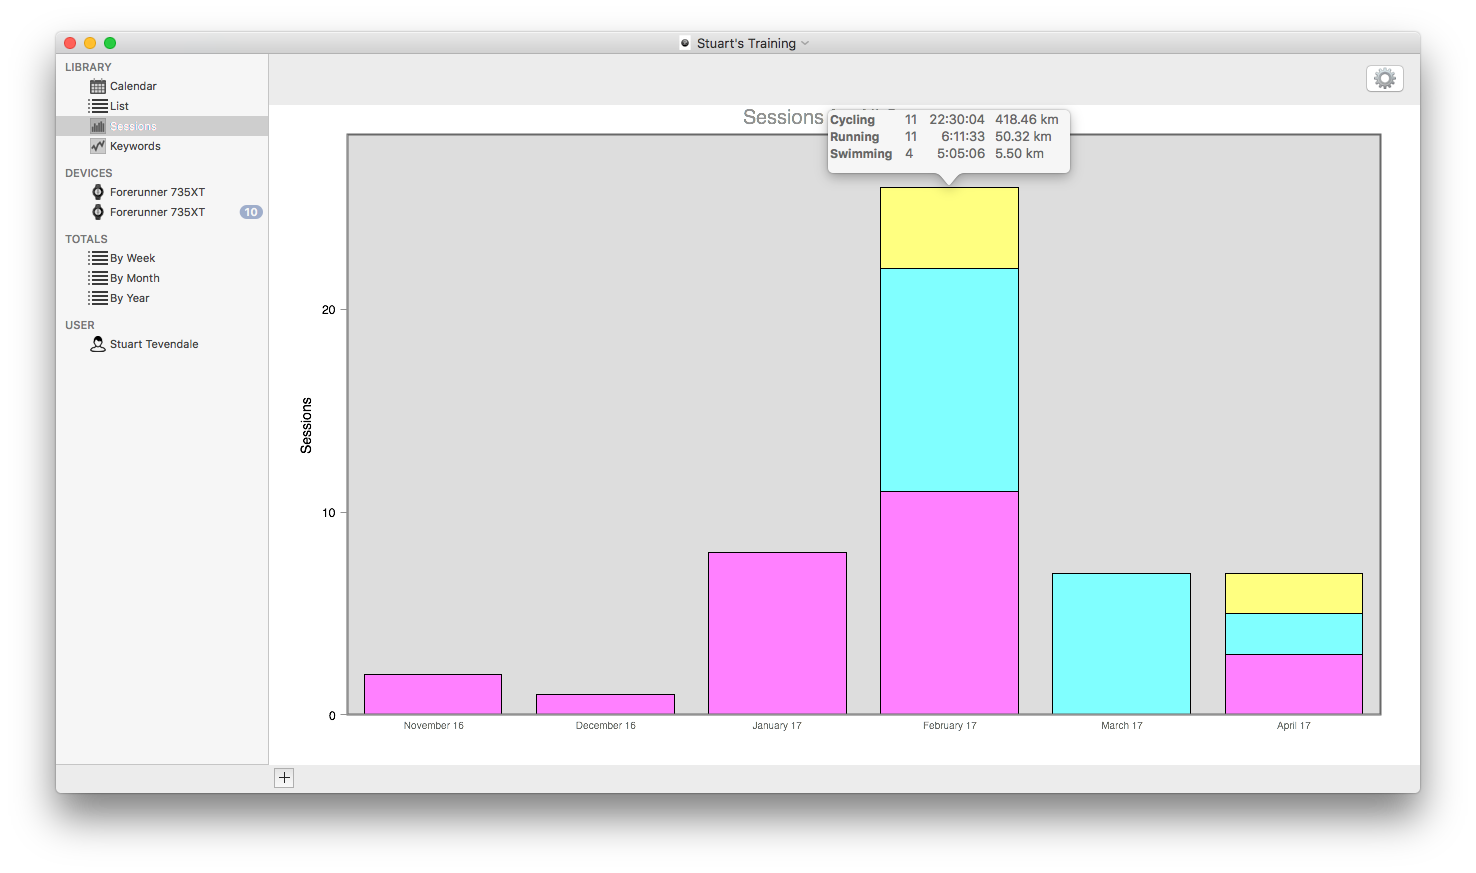
Data can be viewed as a bar graph, showing the number of sessions, training time, distance, etc., per week or month. This can viewed over a period from 4 weeks to 24 months, with a selectable starting date. Session intensity can also be shown, using TRIMP.
The total training time, distance, sessions and average speed can be displayed, grouped by week, month or year.
Enter Data Manually
Data can also be entered manually, if a heart monitor is not available. Data such as calories burned, fluids & carbohydrates consumed and equipment used can also be entered. Heart rate zone can data also be entered, if your heart monitor provides this data, but doesn't have download capability.
Import Data
Data can be imported from a number of other training applications, including Garmin connect & Training Center, PowerTap's PowerAgent, Polar PPP and SRM's software allowing you to keep all your training records in one application.
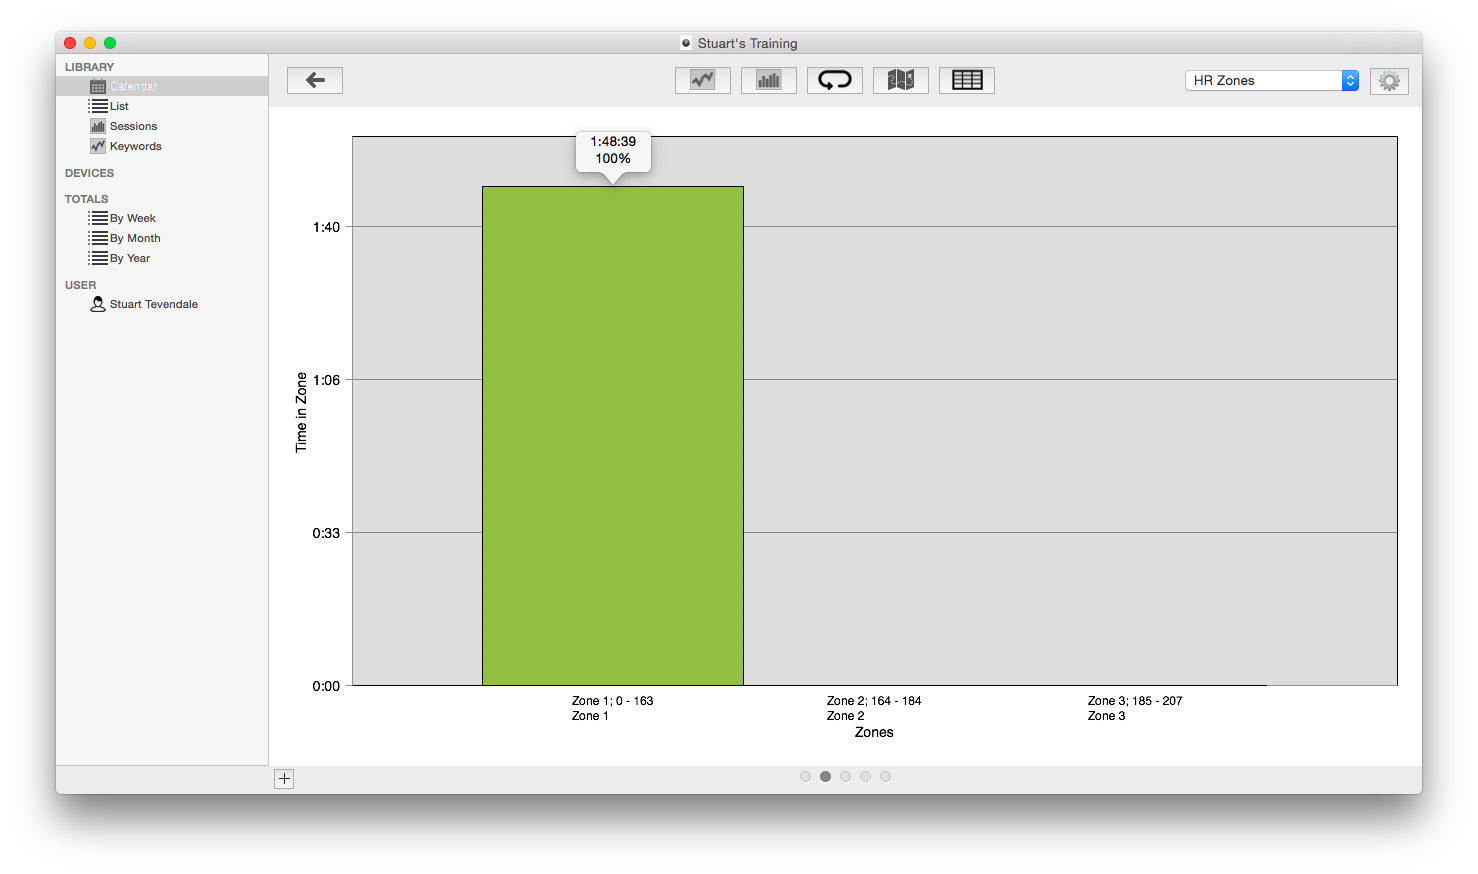
Show Data Distribution & HR Zones
The downloaded data can also be shown as a distribution graph, showing the amount of time spent between two limits (e.g. the time spent at a speed between 10 km/hr and 20 km/hr, 20km/hr and 30 km/hr, etc.). Heart rate, speed, cadence and power data can be shown on this graph. The time spent in your heart rate zones can also be shown.